Spark Memory Fundamentals: How Executors Really Allocate Memory

If you’ve ever wondered why your Spark jobs run out of memory or why some tasks spill to disk while others fly through, you’re in the right place. Today we’re diving into one of the most important aspects of Apache Spark: how it actually manages memory across executors.
This is the first part of a two-part series on Spark memory management. Here we’ll cover the core architecture and fundamental concepts. In Part 2, we’ll explore advanced optimizations, Project Tungsten, and troubleshooting strategies.
Why should I care about memory management?
One of the key reasons Spark revolutionized big data processing is its ability to keep data in memory rather than constantly reading from and writing to disk. The speed difference is huge:
| Storage Medium | Typical Speed | Relative Performance |
|---|---|---|
| DDR4/DDR5 RAM | 20-60 GB/s | 200-600x faster than HDD |
| NVMe SSD | 3-7 GB/s | 30-70x faster than HDD |
| SATA SSD | 200-550 MB/s | 2-5x faster than HDD |
| HDD (7200 RPM) | 80-160 MB/s | Baseline |
| Gigabit Network | ~100-115 MB/s | Similar to HDD |
Note: These values represent typical modern hardware. Actual performance varies by specific hardware generation, configuration, and workload patterns.
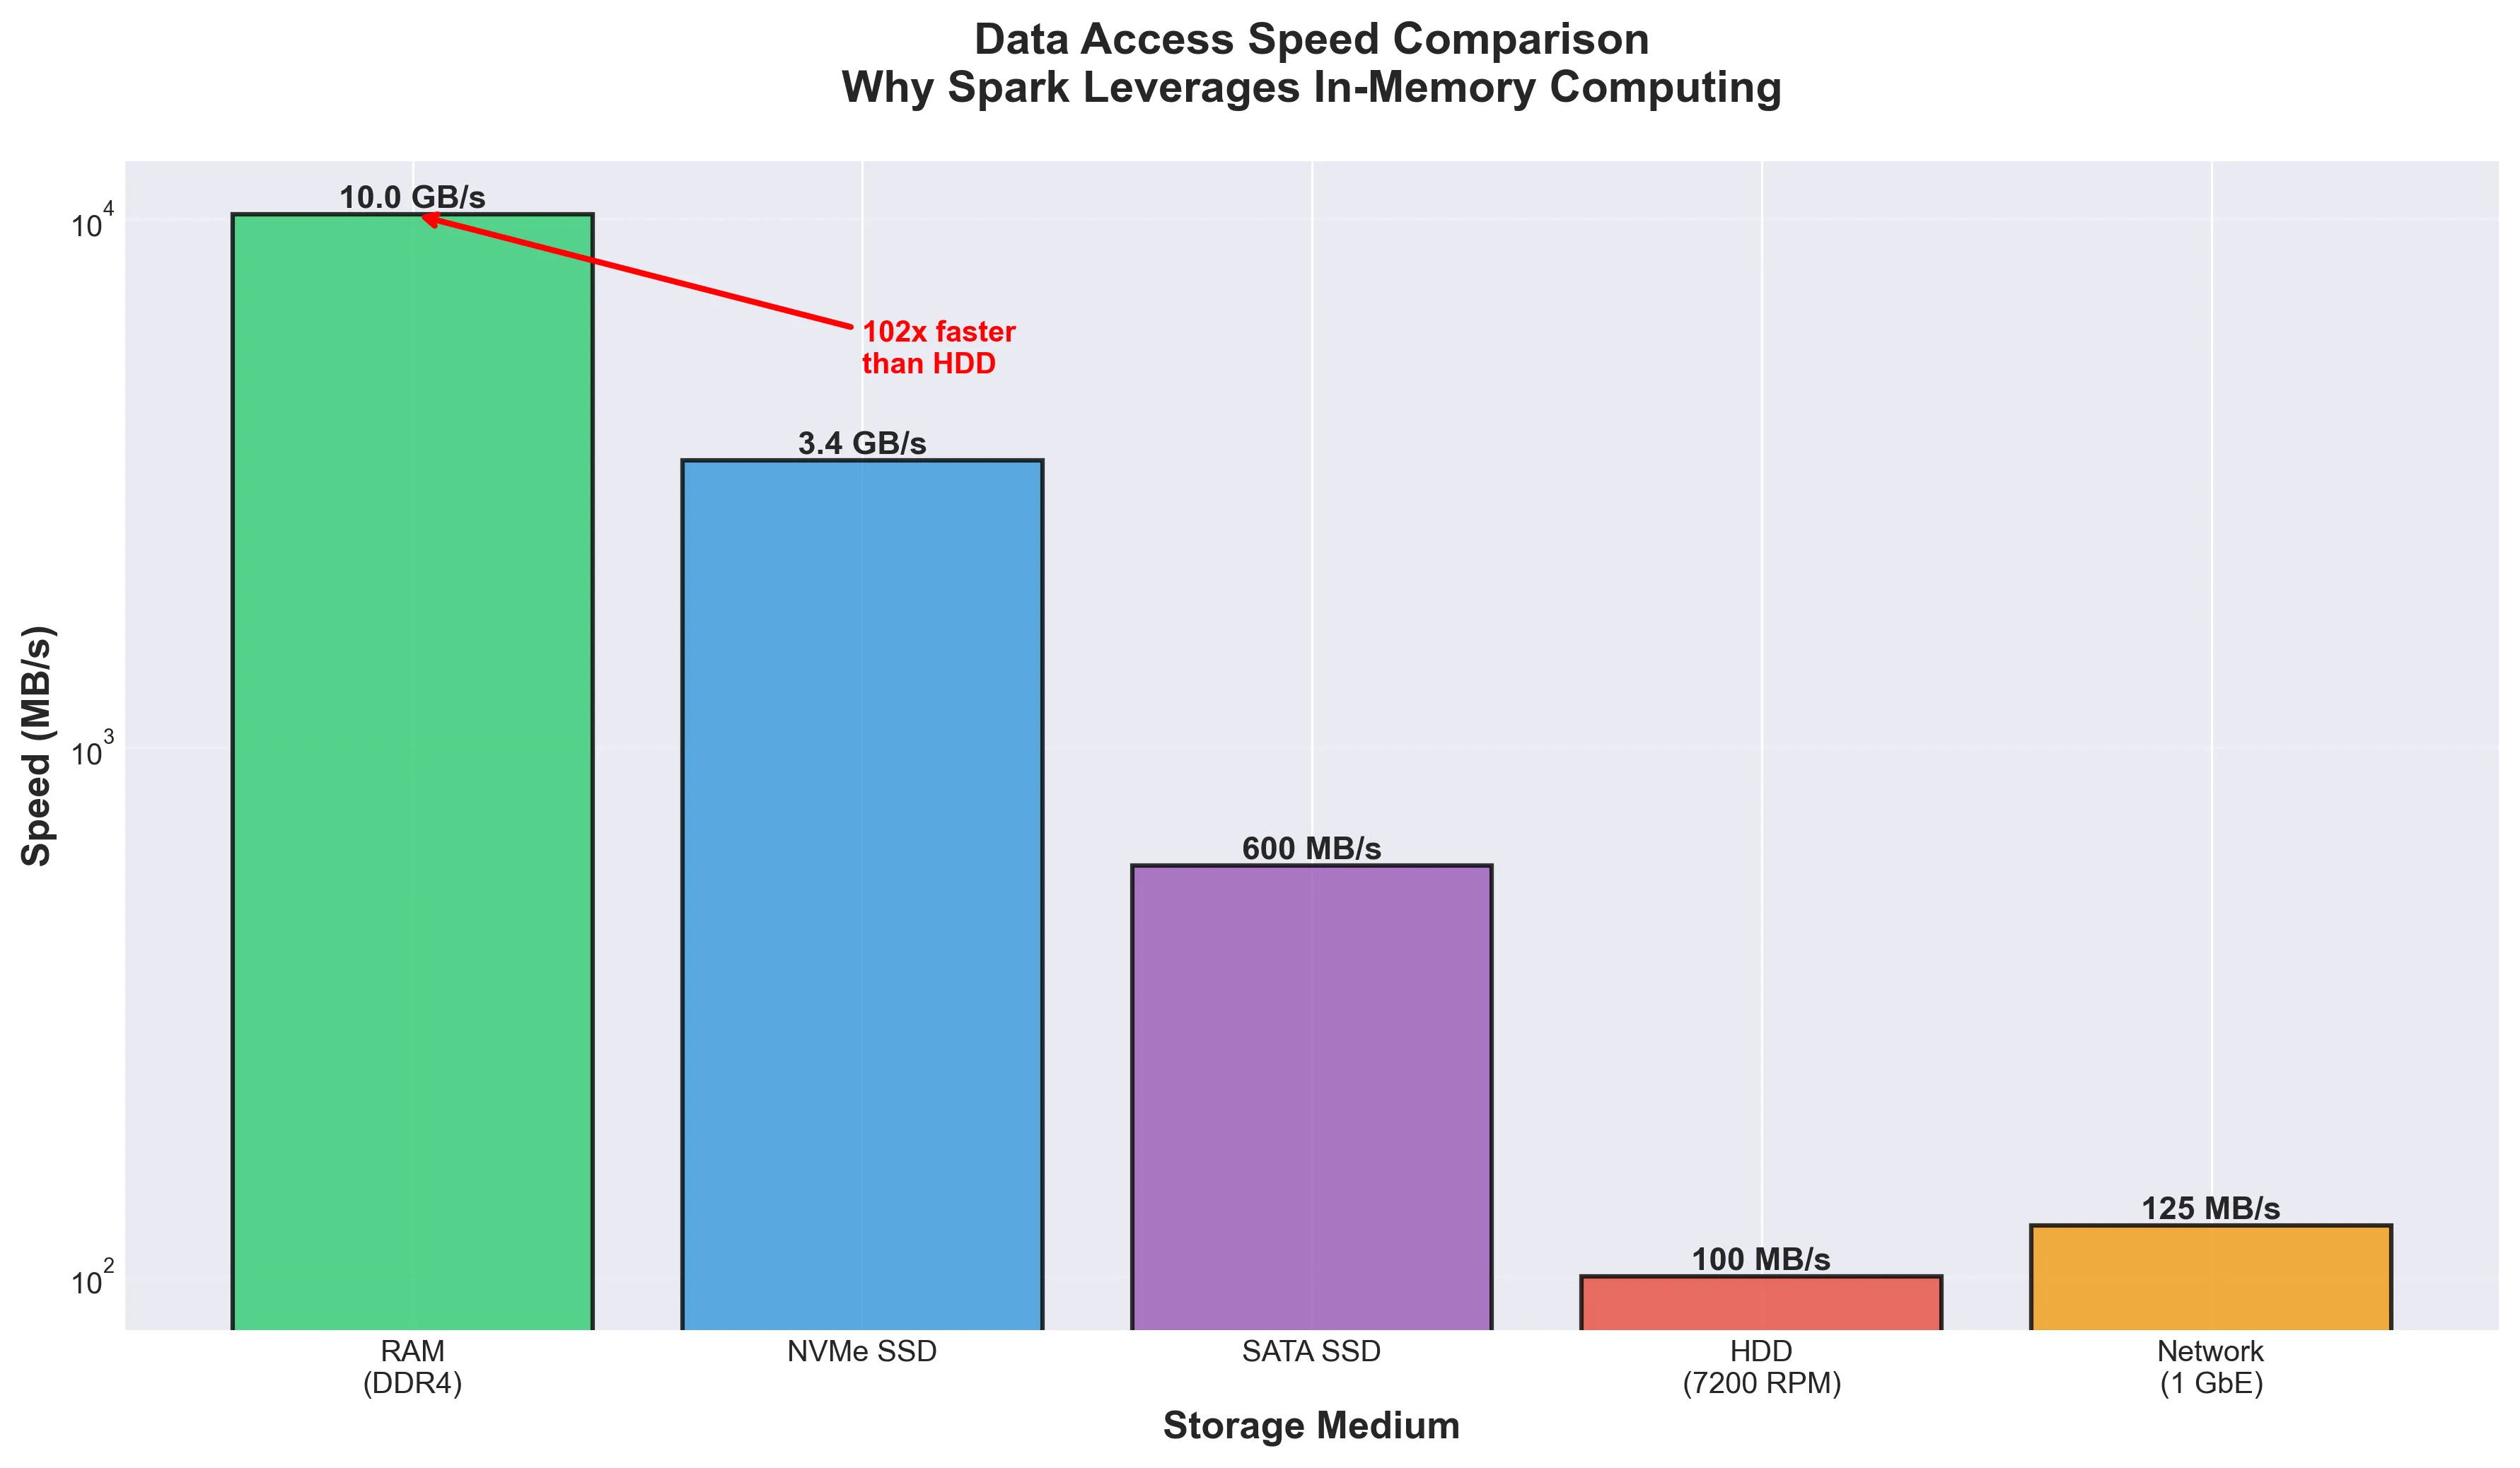
This massive performance advantage makes memory management not just an optimization concern, but a fundamental aspect of Spark application design. Get it wrong and your job will crawl; get it right and you’ll wonder why anyone still uses MapReduce.
The memory management hierarchy
Memory management in Spark isn’t just one thing—it operates at multiple levels:
- Operating System level: Physical RAM management and virtual memory
- Cluster Manager level (YARN/Kubernetes/Mesos): Container resource allocation
- JVM level: Heap management and garbage collection
- Spark level: Unified memory management within executors
When you configure Spark memory settings, you’re primarily working at the Spark and JVM levels, but these decisions ripple through the entire stack. Understanding this hierarchy helps explain why memory issues can show up in weird ways.
How executor memory actually works
In Apache Spark, each executor’s memory is divided into several regions, each with a specific job. When Spark runs on cluster managers like YARN or Kubernetes, it requests containers to execute work. Each executor runs as a separate JVM process within these containers.
Total container memory
The total memory requested from the cluster manager isn’t just the executor memory—there’s more to it:
\[\text{Total Container Memory} = \text{Executor Memory} + \text{Memory Overhead} + \text{Off-Heap Memory (if enabled)} + \text{PySpark Memory (if configured)}\]Note: All these components are additive. If any are not configured, they default to 0 and don’t consume additional memory.
Let’s break this down piece by piece.
Memory overhead
Before Spark can use memory for its operations, it reserves a chunk for memory overhead. Think of this as the “tax” Spark pays to the JVM and the operating system. This overhead covers:
- JVM internal operations: Metadata and internal JVM structures
- Interned strings: String pool memory
- Native libraries: Non-JVM operations (like Netty for networking)
- Thread stacks: Memory for executor threads
- PySpark processes: Python interpreter memory when using PySpark. When
spark.executor.pyspark.memoryis explicitly configured, it becomes a separate memory allocation beyondspark.executor.memoryOverhead; otherwise, Python processes consume part of the overhead memory.
The formula is pretty straightforward:
\[\text{Memory Overhead} = \max(\text{Executor Memory} \times 0.1, 384\text{ MB})\]So it’s basically 10% of your executor memory, with a minimum of 384 MB. Let’s see some examples:
- If executor memory is 5 GB: overhead = max(5120 MB × 0.1, 384 MB) = 512 MB
- If executor memory is 1 GB: overhead = max(1024 MB × 0.1, 384 MB) = 384 MB
- If executor memory is 10 GB: overhead = max(10240 MB × 0.1, 384 MB) = 1024 MB
You can explicitly configure this using spark.executor.memoryOverhead. One important thing: starting from Spark 3.0, off-heap memory (spark.memory.offHeap.size) is calculated independently and is NOT included in spark.executor.memoryOverhead. However, both are additive to the total container memory—meaning the container size is the sum of executor memory, overhead, off-heap memory, and PySpark memory if applicable.
graph TB
    A[Total Container Memory] --> B[Memory Overhead
~10% or 384MB min]
    A --> C[Executor Memory
JVM Heap]
    A --> D[Off-Heap Memory
Optional]
    A --> E[PySpark Memory
If using Python]

    B --> B1[JVM Overhead]
    B --> B2[Native Libraries]
    B --> B3[Thread Stacks]

    style A fill:#e1f5ff
    style B fill:#ffe1e1
    style C fill:#e1ffe1
    style D fill:#fff4e1
    style E fill:#ffe1ff
On-heap vs off-heap memory
Spark supports two types of memory allocation; choosing between them can be important depending on your workload:
On-heap memory (the default):
- Managed by the Java Virtual Machine (JVM)
- Subject to garbage collection
- Easier to configure and debug
- Can introduce GC pauses in processing
Off-heap memory (optional):
- Allocated outside the JVM heap using Java’s
sun.misc.UnsafeAPI - Not subject to garbage collection
- More predictable performance for certain workloads
- Enabled with
spark.memory.offHeap.enabled=true - Size configured with
spark.memory.offHeap.size
The unified memory manager
Since Spark 1.6, the platform uses Unified Memory Management, which replaced the older Static Memory Management model. This is a pretty big deal, so let’s talk about why it matters.
The old way: Static Memory Manager
Before Spark 1.6, memory management was handled by StaticMemoryManager, and it had some serious limitations:
- Storage and execution memory had fixed sizes defined at startup
- No dynamic borrowing between regions
- Often led to inefficient memory utilization (one region starving while another had plenty of free space)
- Required manual tuning of separate parameters for different workloads
The UnifiedMemoryManager fixes these issues through dynamic memory sharing. While you can still enable the legacy mode with spark.memory.useLegacyMode=true, this is strongly discouraged. It only exists for backward compatibility and you really shouldn’t use it.
How memory is actually divided
Within the executor memory (JVM heap), Spark divides the space into several regions. Let’s see how:
graph TB
    A[Executor Memory
JVM Heap] --> B[Reserved Memory
300 MB Fixed]
    A --> C[Usable Memory
Executor Memory - 300MB]
    C --> D[User Memory
40% by default]
    C --> E[Unified Memory
60% by default]
    E --> F[Storage Memory
30% of Usable]
    E --> G[Execution Memory
30% of Usable]

    style A fill:#e1f5ff
    style B fill:#ffe1e1
    style D fill:#fff4e1
    style E fill:#e1ffe1
    style F fill:#e1e1ff
    style G fill:#ffe1ff
1. Reserved memory (300 MB)
A fixed 300 MB is reserved for Spark internals and system operations. This value is hardcoded in the Spark source code as RESERVED_SYSTEM_MEMORY_BYTES. Think of it as Spark’s safety net—it ensures that Spark has enough space to function even when things get tight.
Important: If the executor memory is less than 1.5 times the reserved memory (i.e., less than 450 MB), Spark will fail with a “please use larger heap size” error. Don’t try to run Spark with tiny executors!
The remaining memory after this reservation is called usable memory:
\[\text{Usable Memory} = \text{Executor Memory} - 300\text{ MB}\]2. User memory
User memory occupies the remaining fraction of usable memory (1 - spark.memory.fraction). With the default setting (spark.memory.fraction=0.6), 40% of usable memory goes to user memory:
Here’s the catch: user memory is completely unmanaged by Spark. It’s the wild west. It stores:
- RDD transformation metadata: Information about dependencies and lineage
- User-defined data structures: Custom objects created in your code
- UDFs (User-Defined Functions): Memory used by custom functions
- Internal Spark metadata: Information for tracking RDD lineage
Critical: Spark does not track what you store here or enforce its boundary. If you exceed this memory, you’ll get OutOfMemoryError exceptions and Spark won’t be able to help you. It’s entirely on you to manage this space wisely.
3. Unified memory region
The unified memory region accounts for 60% of usable memory by default and is where the magic happens—it’s shared dynamically between storage and execution:
\[\text{Unified Memory} = \text{Usable Memory} \times \text{spark.memory.fraction}\]This is where Spark’s dynamic memory management really shines. The region is initially split equally between storage and execution (controlled by spark.memory.storageFraction, which defaults to 0.5).
Storage memory
Storage memory handles:
- Cached/persisted RDDs and DataFrames: When you call
cache()orpersist() - Broadcast variables: Shared read-only data distributed to all executors
- Unroll memory: Temporary space to deserialize serialized blocks into memory
When storage memory needs to free up space, Spark uses a Least Recently Used (LRU) algorithm to kick out cached blocks. How painful eviction is depends on the storage level you choose:
| Storage Level | Eviction Cost | Reason |
|---|---|---|
MEMORY_ONLY |
High | Evicted data must be recomputed from source |
MEMORY_AND_DISK |
Medium | Evicted blocks written to disk and can be read back |
MEMORY_AND_DISK_SER |
Low | Data already serialized, only disk I/O needed |
Execution memory
Execution memory handles the heavy lifting:
- Shuffle operations: Data redistribution across partitions, including intermediate buffers
- Joins: Hash tables for join operations (especially hash joins)
- Sorts: Temporary buffers for sorting operations
- Aggregations: Data structures for grouping and aggregating
This memory pool supports spilling to disk when insufficient memory is available. However, unlike storage memory, blocks from execution memory cannot be forcefully evicted by other tasks. If execution memory is exhausted and can’t borrow from storage, Spark will spill data to disk to keep processing.
Here’s the thing: Most performance issues in Spark stem from insufficient execution memory leading to excessive disk spilling. If you see your jobs crawling, this is often why.
Dynamic memory borrowing (the cool part)
The beauty of unified memory management is its dynamic nature. When one region needs more memory and the other has free space, borrowing happens automatically:
sequenceDiagram
    participant E as Execution Memory
    participant S as Storage Memory
    participant U as Unified Memory Pool

    Note over E,S: Initial state: 50-50 split

    rect rgb(240, 255, 240)
        Note over E,S: Scenario 1: Execution needs more
        E->>U: Request additional memory
        U->>S: Check available space
        alt Storage has free space
            S->>E: Lend memory immediately
            Note over E,S: Execution uses borrowed space
        else Storage full but can evict
            S->>S: Evict cached blocks (LRU)
            S->>E: Lend freed memory
        else Storage cannot free memory
            E->>E: Spill to disk
        end
    end

    rect rgb(255, 240, 240)
        Note over E,S: Scenario 2: Storage needs more
        S->>U: Request additional memory
        U->>E: Check available space
        alt Execution has free space
            E->>S: Lend memory immediately
            Note over E,S: Storage uses borrowed space
        else Execution is full
            Note over S: Cannot evict execution memory
            S->>S: Evict own blocks (LRU)
        end
    end
The borrowing rules (pay attention, this is important):
- Execution can borrow from storage: If storage memory has free space, execution can grab it without any restrictions
- Storage can borrow from execution: If execution memory is free, storage can use it
- Execution memory cannot be evicted: When storage needs memory back, it cannot forcibly take it from execution
- Storage memory can be evicted: Cached blocks can be removed using LRU policy to free up space
Why this asymmetry? Simple:
- Execution operations are part of active computations that can’t be interrupted without causing task failures
- Cached data can be recomputed from RDD lineage or read from disk if evicted
Execution wins over storage because a task crash is worse than evicting cached data. Makes sense, right?
A practical example
Let’s walk through a real example with a 12 GB executor to see how all this plays out in practice:
Executor Memory: 12 GB (12,288 MB)

1. Memory Overhead:
   max(12,288 × 0.1, 384) = max(1,228.8, 384) = 1,229 MB

2. Actual Executor Memory:
   12,288 MB (JVM heap)

3. Reserved Memory:
   300 MB (hardcoded)

4. Usable Memory:
   12,288 - 300 = 11,988 MB

5. User Memory (40%):
   11,988 × 0.4 = 4,795 MB

6. Unified Memory (60%):
   11,988 × 0.6 = 7,193 MB

7. Initial split (50-50):
   Storage: 7,193 × 0.5 = 3,596 MB
   Execution: 7,193 × 0.5 = 3,596 MB

Total Container Memory:
12,288 (executor) + 1,229 (overhead) = 13,517 MB ≈ 13.2 GB
So with these defaults, requesting a 12 GB executor results in about 13.2 GB total container memory. Keep that in mind when planning your resource allocation!
Configuration parameters you should know
Here are the key memory configuration parameters:
# Executor memory (JVM heap)
spark.executor.memory=12g

# Memory overhead (auto-calculated or explicit)
spark.executor.memoryOverhead=1229m

# Fraction of heap for unified region (default: 0.6)
spark.memory.fraction=0.6

# Fraction of unified memory for storage (default: 0.5)
spark.memory.storageFraction=0.5

# Off-heap memory (disabled by default)
spark.memory.offHeap.enabled=false
spark.memory.offHeap.size=0

# Executor cores (affects task concurrency)
spark.executor.cores=4
Task-level memory management
While the MemoryManager handles executor-level memory allocation, individual tasks need their fair share too. You don’t want the first task consuming all the memory, right?
TaskMemoryManager
TaskMemoryManager sits between tasks and the MemoryManager. It’s like a middleman that:
- Memory acquisition: Requesting memory from MemoryManager on behalf of tasks
- Memory release: Returning memory when tasks complete
- Accounting: Tracking how much memory each task uses
Memory per task
Tasks within an executor run as threads that share the same JVM. The memory available to each task is managed dynamically through TaskMemoryManager (see [3] for source code) and allocated on-demand from the execution memory pool. This ensures fair distribution of execution memory among concurrent tasks.
With multiple concurrent tasks, memory is allocated dynamically. Each task can acquire memory from the execution memory pool based on availability. When execution memory becomes constrained:
- If a task cannot acquire more memory, it will attempt to spill intermediate data to disk
- Memory becomes available when other tasks complete and release their allocations
- The system prioritizes continued execution over immediate failure
| Concurrent Tasks | Memory Allocation | Typical Behavior |
|---|---|---|
| 1 task | On-demand, up to full execution memory | Single task uses available execution space |
| 2 tasks | Shared on-demand | Both tasks request memory as needed |
| 4 tasks | Shared on-demand | Higher contention, possible disk spilling |
| 8+ tasks | Shared on-demand | Significant contention, likely disk spilling |
Takeaway: More concurrent tasks mean less memory per task. This is controlled by spark.executor.cores—fewer cores per executor means fewer concurrent tasks and more memory for each task to work with.
Best practices
Here are some tips to keep your Spark jobs running smoothly:
Partition appropriately: Aim for at least 2-3 partitions per CPU core for good parallelism.
Filter early: Reduce data volume as early as possible in your pipeline. The less data you carry through, the less memory you need.
Cache wisely: Only cache data that will be reused multiple times. Caching everything wastes memory for no benefit.
Choose storage levels carefully:
MEMORY_ONLY: Fast but risky if data doesn’t fitMEMORY_AND_DISK: Safe default with automatic spillingMEMORY_ONLY_SER: Save memory with some serialization overheadOFF_HEAP: Predictable performance, no GC pressure
Monitor memory usage: Use Spark UI (http://localhost:4040) to keep an eye on:
- Memory usage per executor
- Spill metrics (memory and disk)
- GC time
- Task serialization time
Wrapping up
Understanding Spark’s memory architecture is key to building efficient applications. Let’s recap what we’ve covered:
- Hierarchical management: Memory is managed at multiple levels (OS, cluster manager, JVM, Spark)
- Unified memory model: Dynamic sharing between storage and execution since Spark 1.6
- Reserved memory: 300 MB is always reserved for Spark internals
- Asymmetric eviction: Execution memory can’t be evicted, but storage memory can
- Task-level fairness: TaskMemoryManager ensures concurrent tasks share memory fairly
- Configuration matters: Proper sizing prevents bottlenecks and OOM errors
In Part 2, we’ll dive into advanced topics including Project Tungsten’s memory optimizations, BlockManager internals, whole-stage code generation, and troubleshooting strategies. Stay tuned!
References
[1] Apache Software Foundation, “Apache Spark Configuration,” 2025.
[2] Apache Software Foundation, “Tuning Spark - Memory Management,” 2025.
[3] Apache Software Foundation, “Spark Memory Management Source Code,” 2024.
[4] M. Zaharia et al., “Resilient Distributed Datasets: A Fault-Tolerant Abstraction for In-Memory Cluster Computing,” in Proc. 9th USENIX Symp. Networked Syst. Design and Implementation (NSDI), San Jose, CA, USA, 2012, pp. 15-28.
[5] M. Armbrust et al., “Spark SQL: Relational Data Processing in Spark,” in Proc. ACM SIGMOD Int. Conf. Management of Data, Melbourne, Australia, 2015, pp. 1383-1394.
[6] H. Karau and R. Warren, High Performance Spark: Best Practices for Scaling and Optimizing Apache Spark. Sebastopol, CA, USA: O’Reilly Media, 2017.
[7] B. Chambers and M. Zaharia, Spark: The Definitive Guide - Big Data Processing Made Simple. Sebastopol, CA, USA: O’Reilly Media, 2018.